Skip to content

Why Stratlyze

Your backtest already hides four things. Stratlyze surfaces every one.

Standard tools optimize for a pretty curve. We surface the truth, then let you check it against the rule thresholds you set.

REAL EQUITY

The floating drawdown a closed-balance curve can’t see.

QuantAnalyzer builds its curve from the closed-trade list, so a position that’s 4,000 underwater for two weeks looks like a flat line until it closes. Stratlyze back-solves every open position and reconstructs the real equity — floating P&L included.

True-equity DD 4.49% vs balance DD 3.57%, same report.
RULE ENGINE

Checks the thresholds you set, not just the curve.

Opt-in and off by default — switch it on only when you trade a prop account. A configurable engine then checks your own backtest against the thresholds you configure: daily-loss, max-drawdown, consistency, min-trading-days, open-risk caps, margin, risk-per-trade, min-hold and weekend-holding. It surfaces your closest call — the binding rule with the least headroom — and on a breach it flags exactly which rule and which day broke it in your backtest.

Closest call: Daily loss · 12% headroom · Tue 14 May

PORTFOLIO

Combine EAs, then model lot factors on your own backtest.

Merge multiple single-EA backtests into one account by summing P&L deltas (not equities — three EAs are not a 300k account). See correlation AND correlation timing: when your strategies draw down together — the tail risk a single correlation number hides. Then you model different per-EA lot multipliers on your own historical backtest and see the recalculated combined result — a user-driven, in-sample what-if (linear scaling, labelled).

Your what-if: EA-A ×0.6, EA-B ×1.0, EA-C ×0.4 → recalculated combined DD (in-sample)

NO FALSE PRECISION

Every number carries its basis.

Each figure is labelled with how it was derived and at what resolution. Single-EA floating from the graph CSV is exact; combined floating is a labelled reconstruction. High-precision mode rebuilds the exact curve from MT5’s own price + FX export. When something can’t be computed exactly, we say so.

FX reconstruction within 0.05% · Sharpe 3.94 vs stated 3.92

Features

Everything you need to analyze a prop-firm backtest. Nothing you don’t.

A focused, honest analyzer — the depth of QuantAnalyzer plus the prop-firm layer it never had.

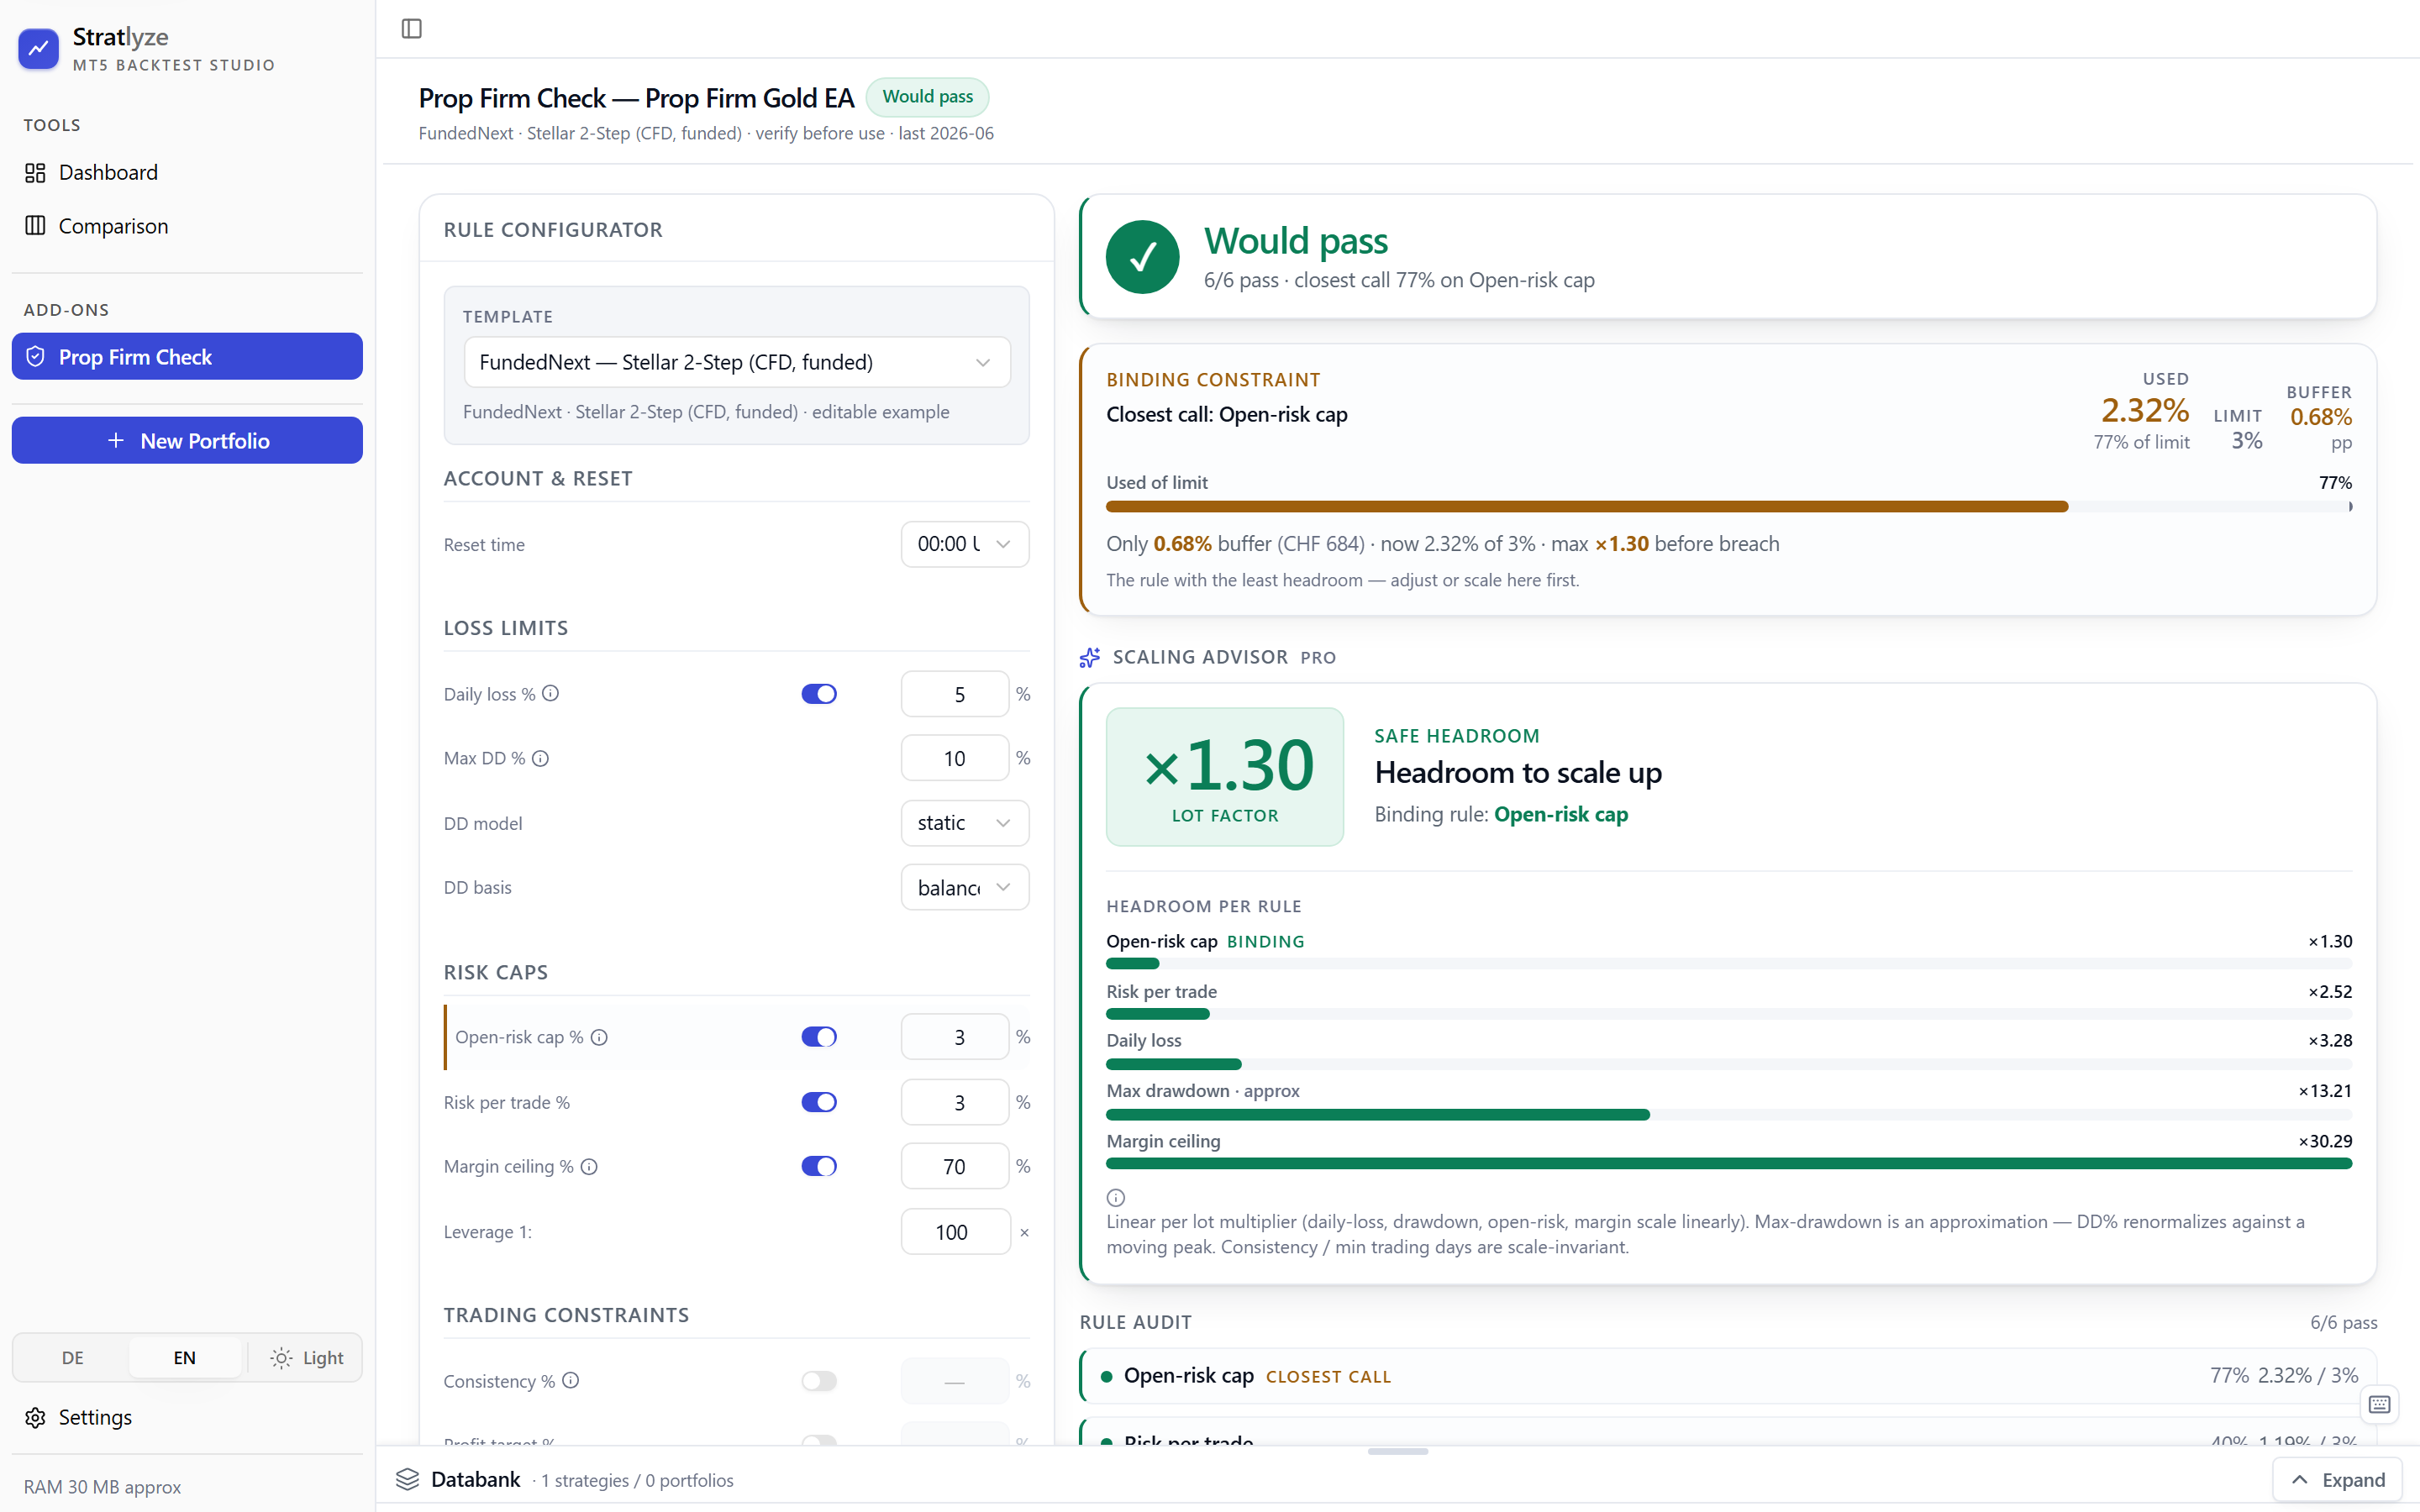
Stratlyze prop-firm rule check: a pass verdict, the binding-constraint open-risk meter reading 2.36%, and the per-rule pass list.

Prop-firm rule engine

Closest-call & breach analysis

Configurable daily-loss, max-drawdown, consistency, min-trading-days, open-risk, margin, risk-per-trade, min-hold and weekend-holding checks. Always know your binding constraint and its headroom; on a breach, the exact rule and day that crossed it.

Worked example: the open-risk cap binds first at 2.36% (vs the cap you configure) — every other rule still passes.

Checks the thresholds you configure — opt-in, off by default. Basis: your backtest’s realized trades.

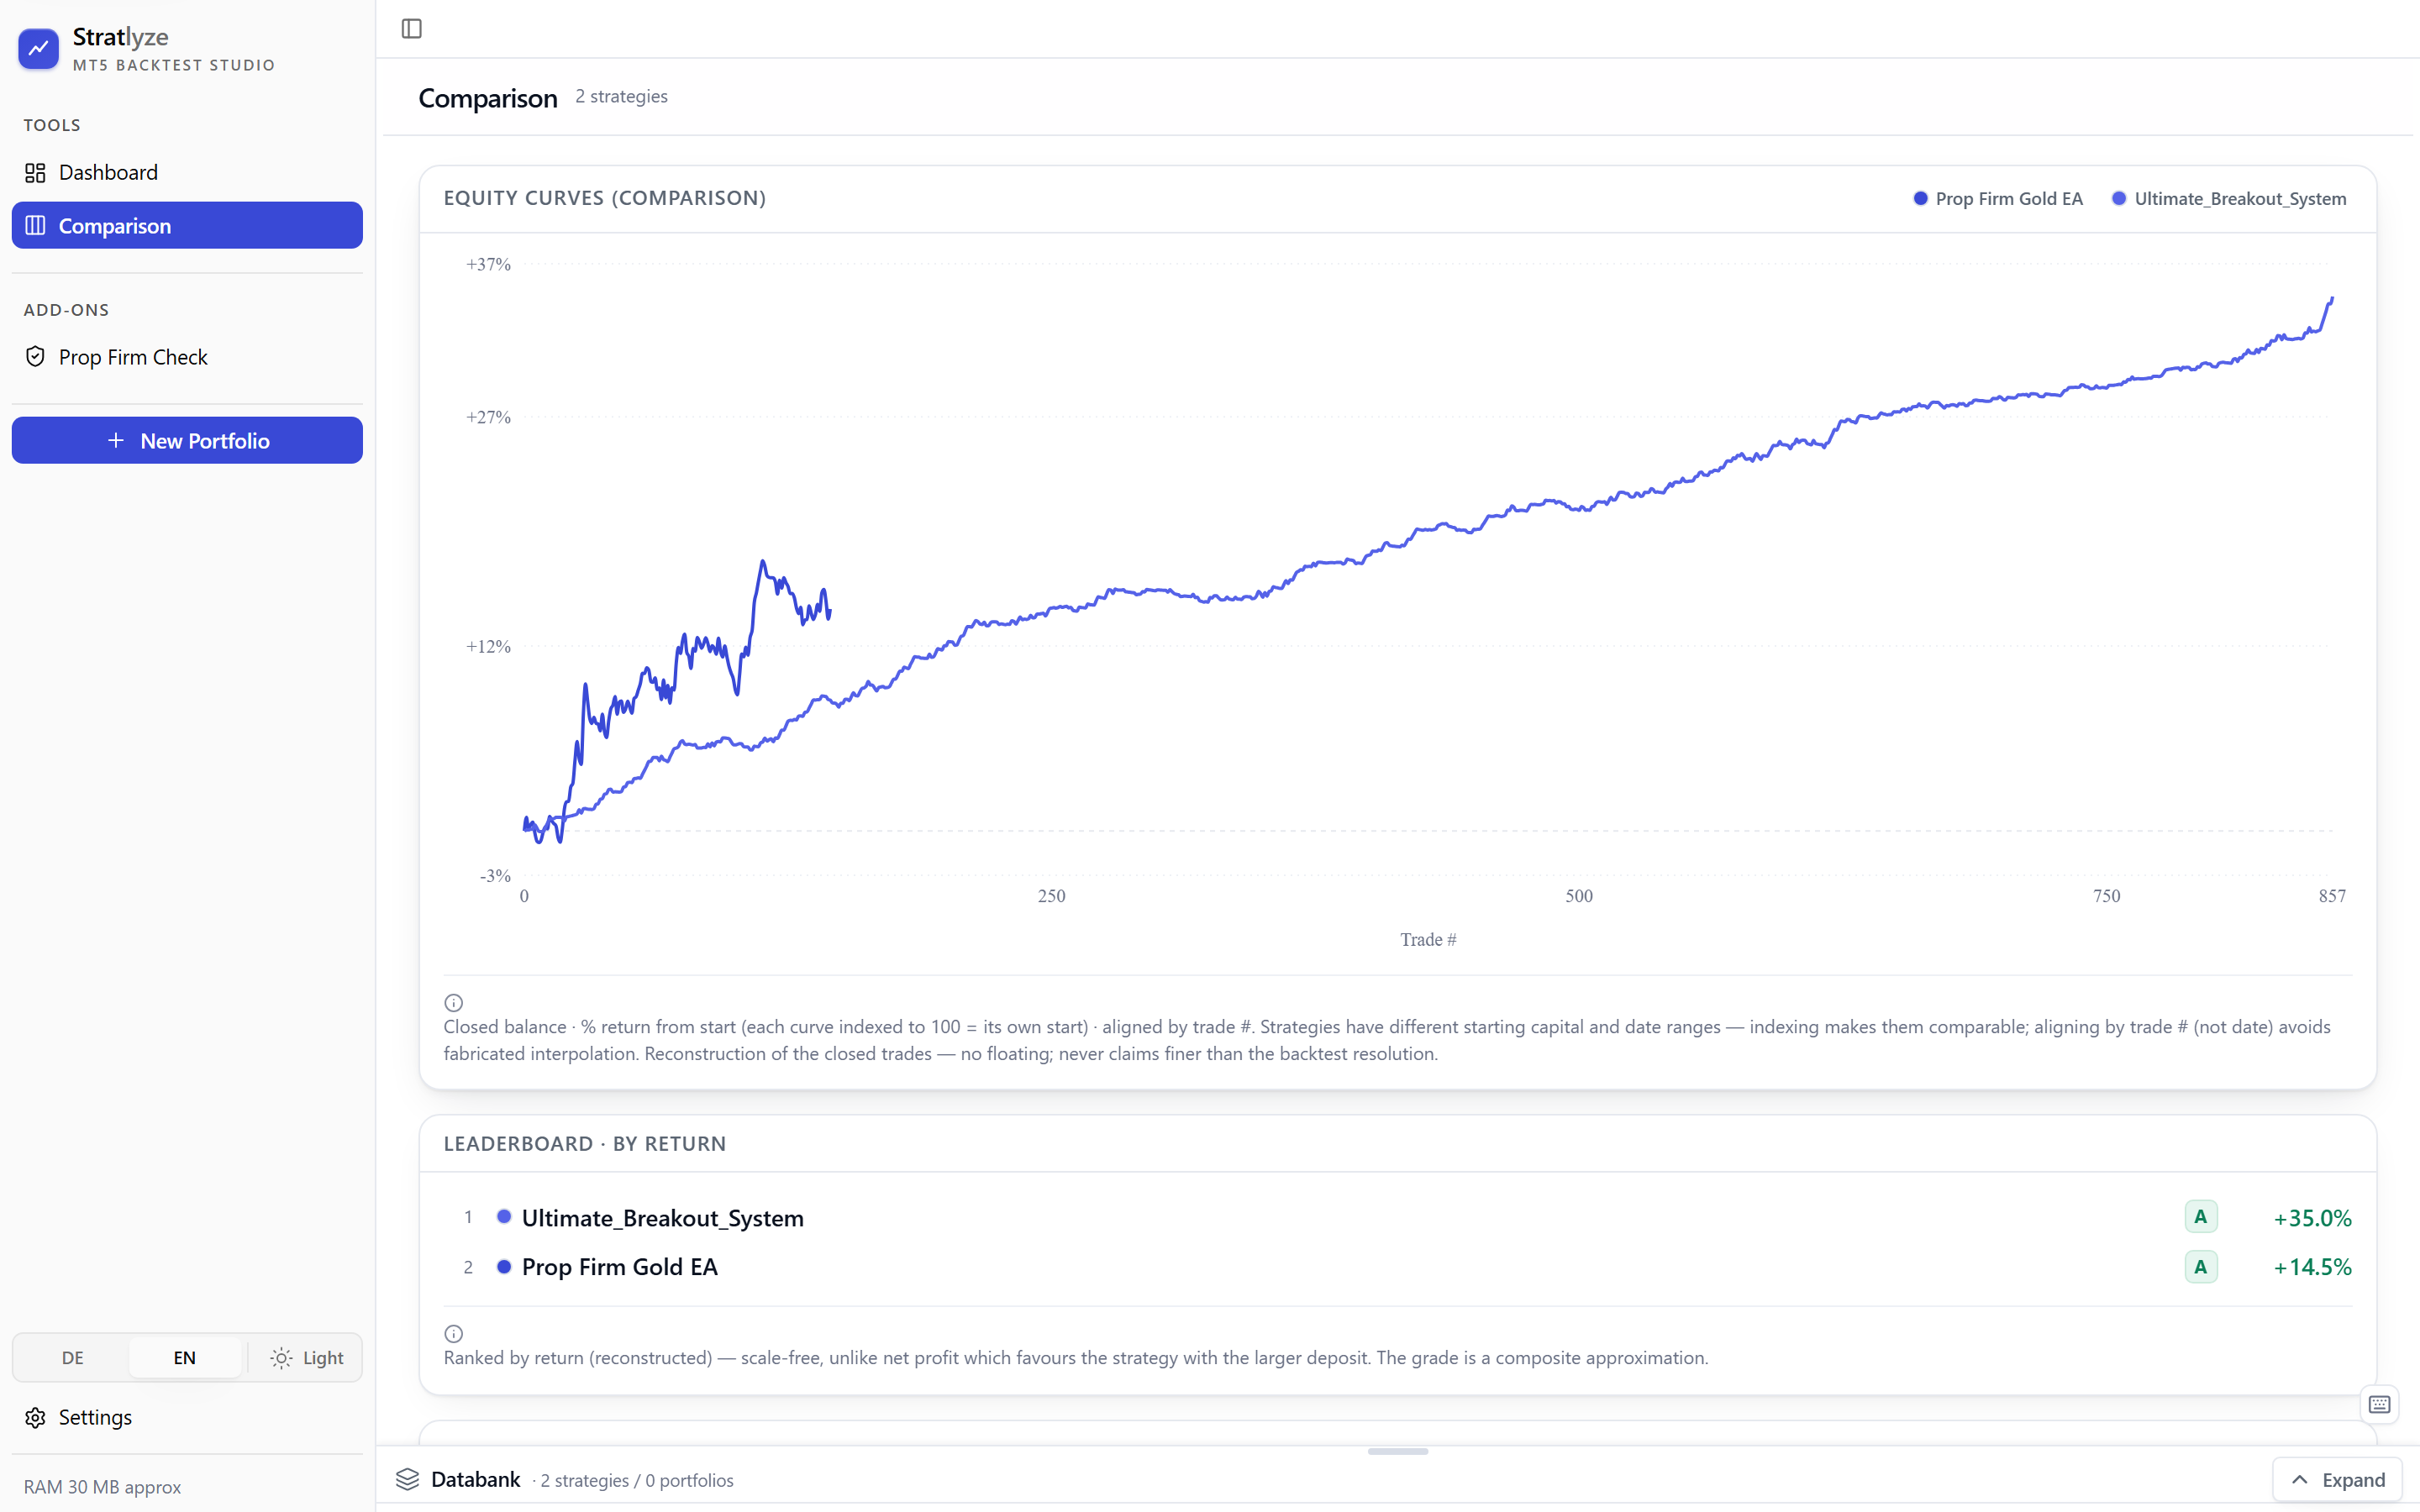
Stratlyze comparison view: two strategy equity curves overlaid and indexed to their own start, aligned by trade number, with a sortable comparison table beneath.

Portfolio combine

Overlay the curves, then combine them

Compare strategies on one chart — each curve indexed to its own start so different deposits and date ranges line up by trade number, never by a faked interpolation. Then merge them into one account by summing P&L deltas over the real date overlap.

Inside a portfolio you also get the correlation matrix and correlation timing — the shared drawdown days a single correlation number hides — what really drives a combined account’s drawdown.

Combined real-equity / floating is a reconstruction over the EAs’ real date overlap — labelled an approximation in-app.

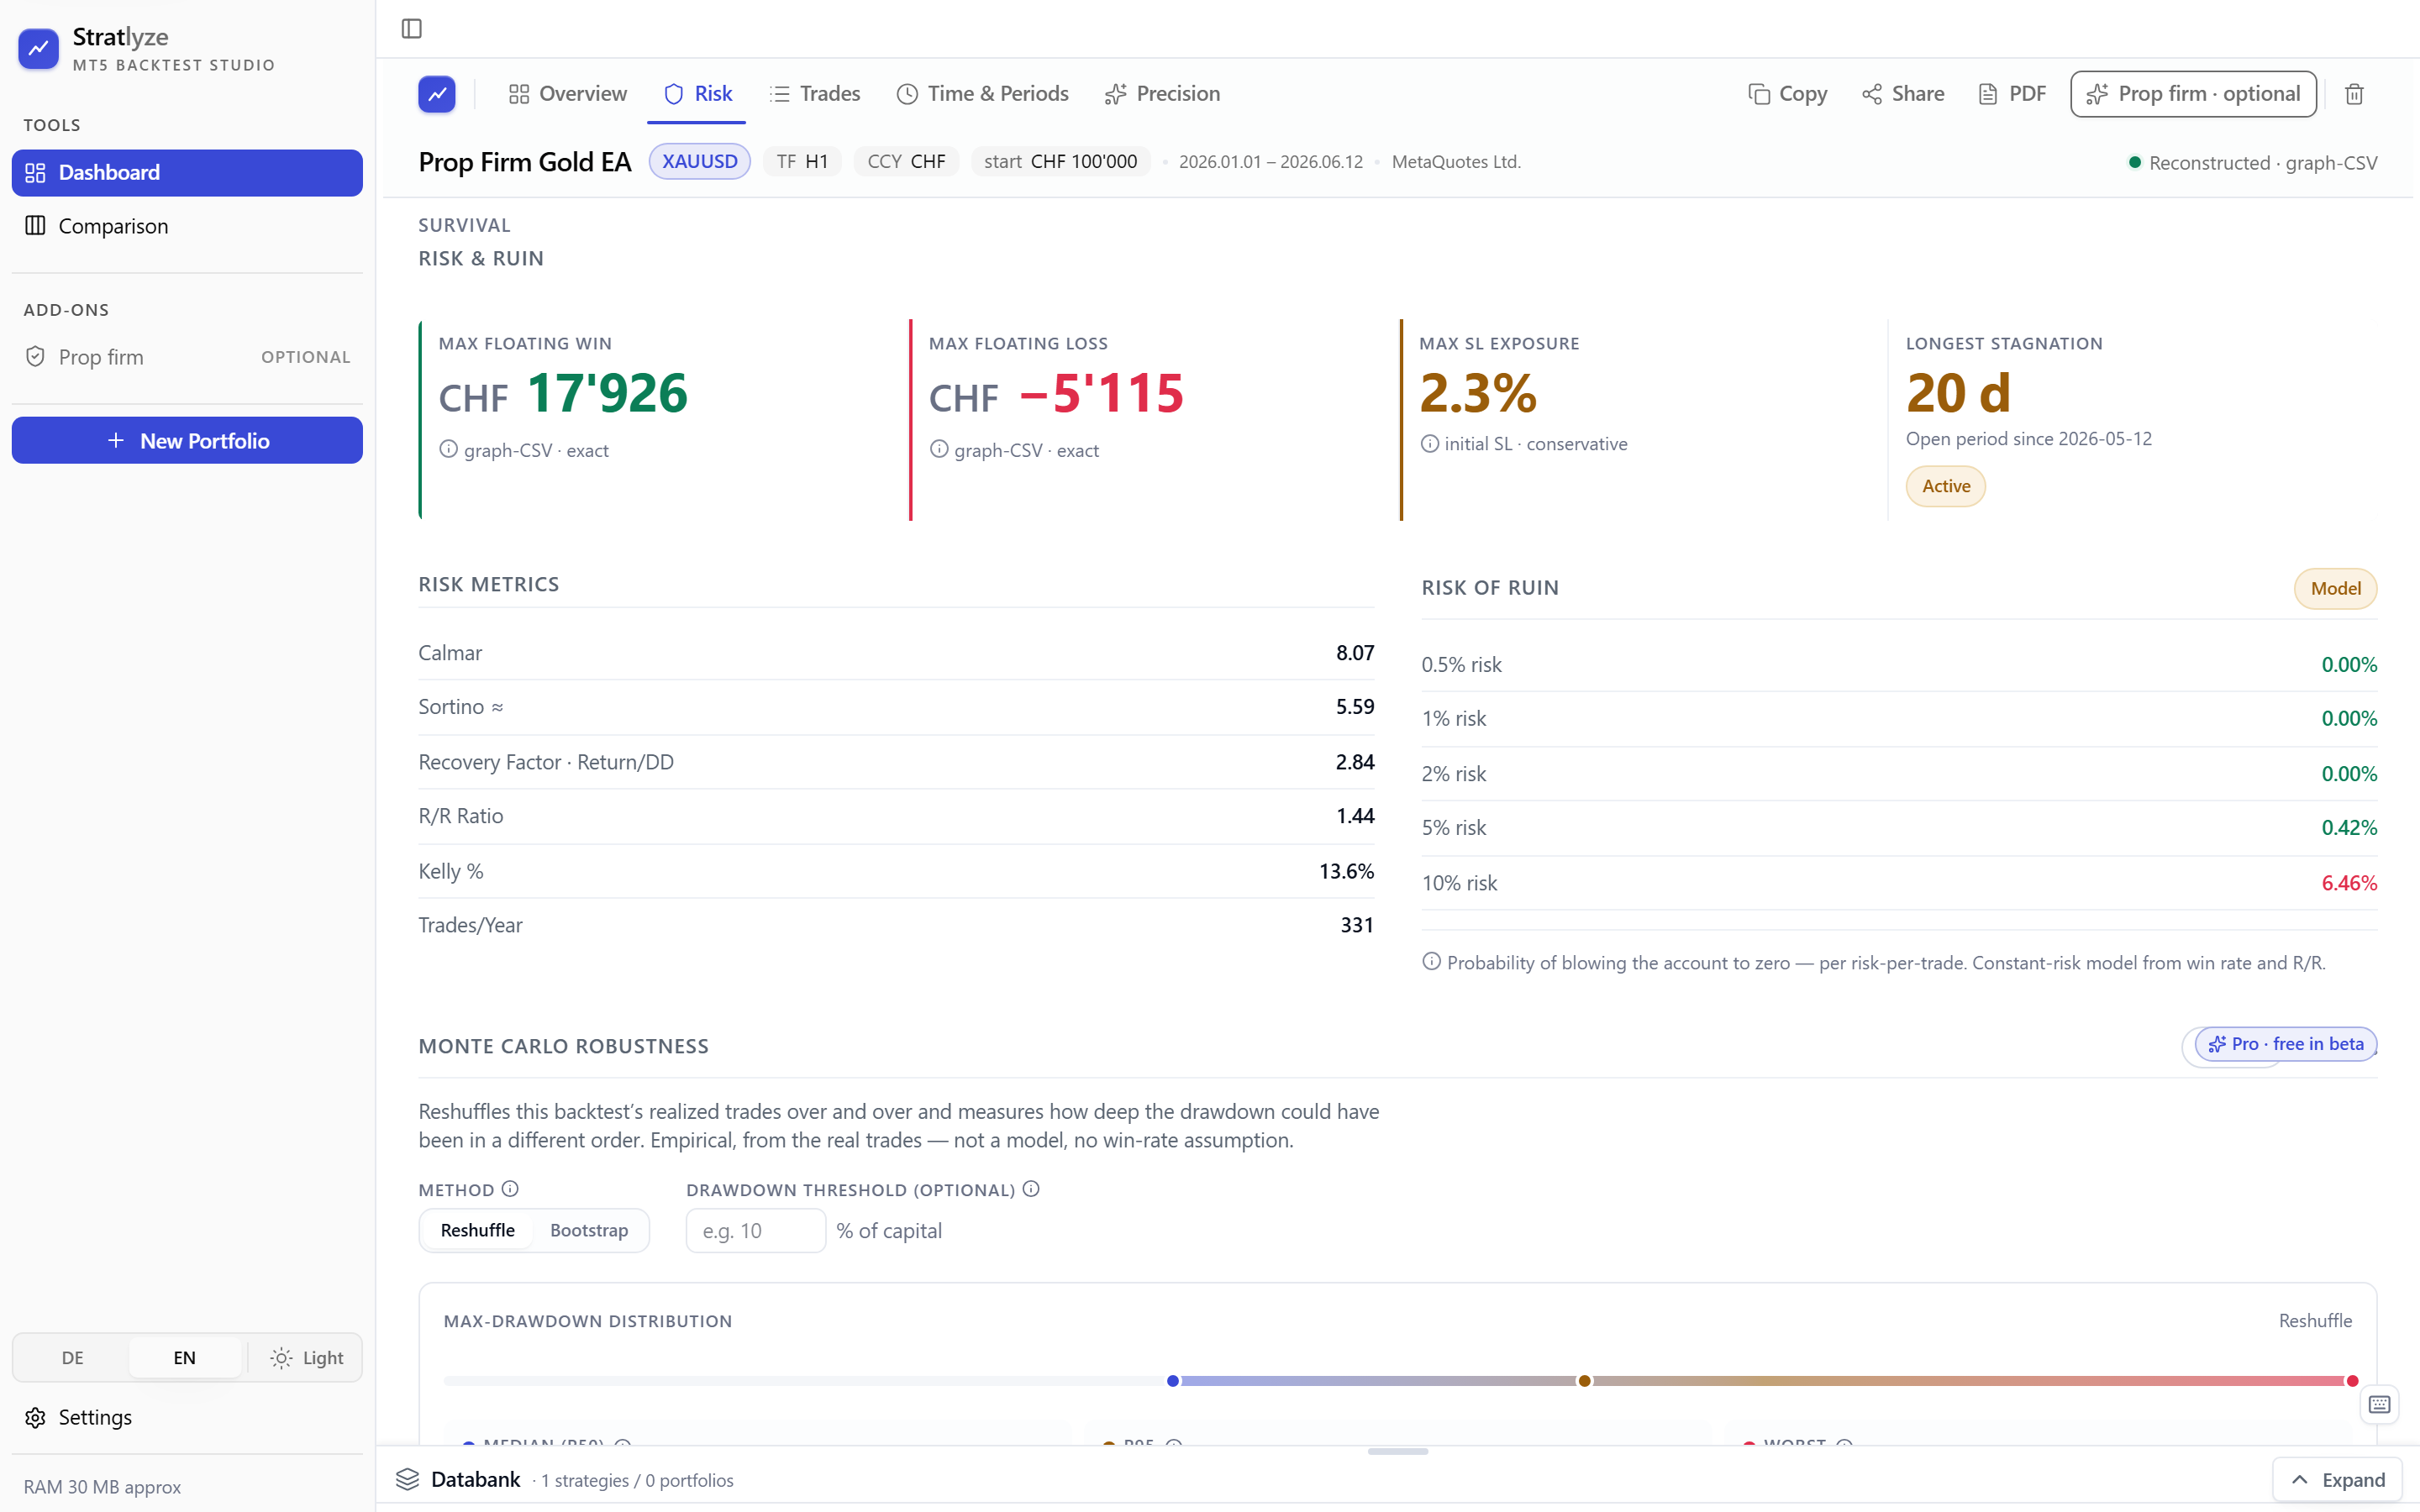
Stratlyze drawdown-distribution Monte Carlo panel: a max-drawdown distribution band from reshuffling the real trades, with the percentile spread and how often the configured threshold is reached.

Drawdown-distribution / sequence-risk Monte Carlo

The threshold you set doesn’t watch your average. It watches your worst drawdown.

We reshuffle your real trades thousands of times to build a max-drawdown distribution band, then measure how often a worse ordering would have reached the threshold you set.

No invented trades, no fitted return model — only the sequence risk hiding in the run you actually backtested. The band shows how bad a different ordering could have been.

Reshuffles your real backtested trades — never invents trades. In-sample · reconstruction · assumes trade-order independence, so a clustered losing streak can run deeper than the band shows.

True equity curve

Real equity with floating P&L, side by side with the closed balance, so you see every drawdown and dead stretch the standard report smooths over.

4.49% true-equity DD vs 3.57% balance DD

Lot-factor what-if

Model per-EA lot factors on your own backtest and see the recalculated combined result against the rule thresholds you set — a user-driven, in-sample what-if.

Linear scaling · in-sample

High-precision / exact Sharpe

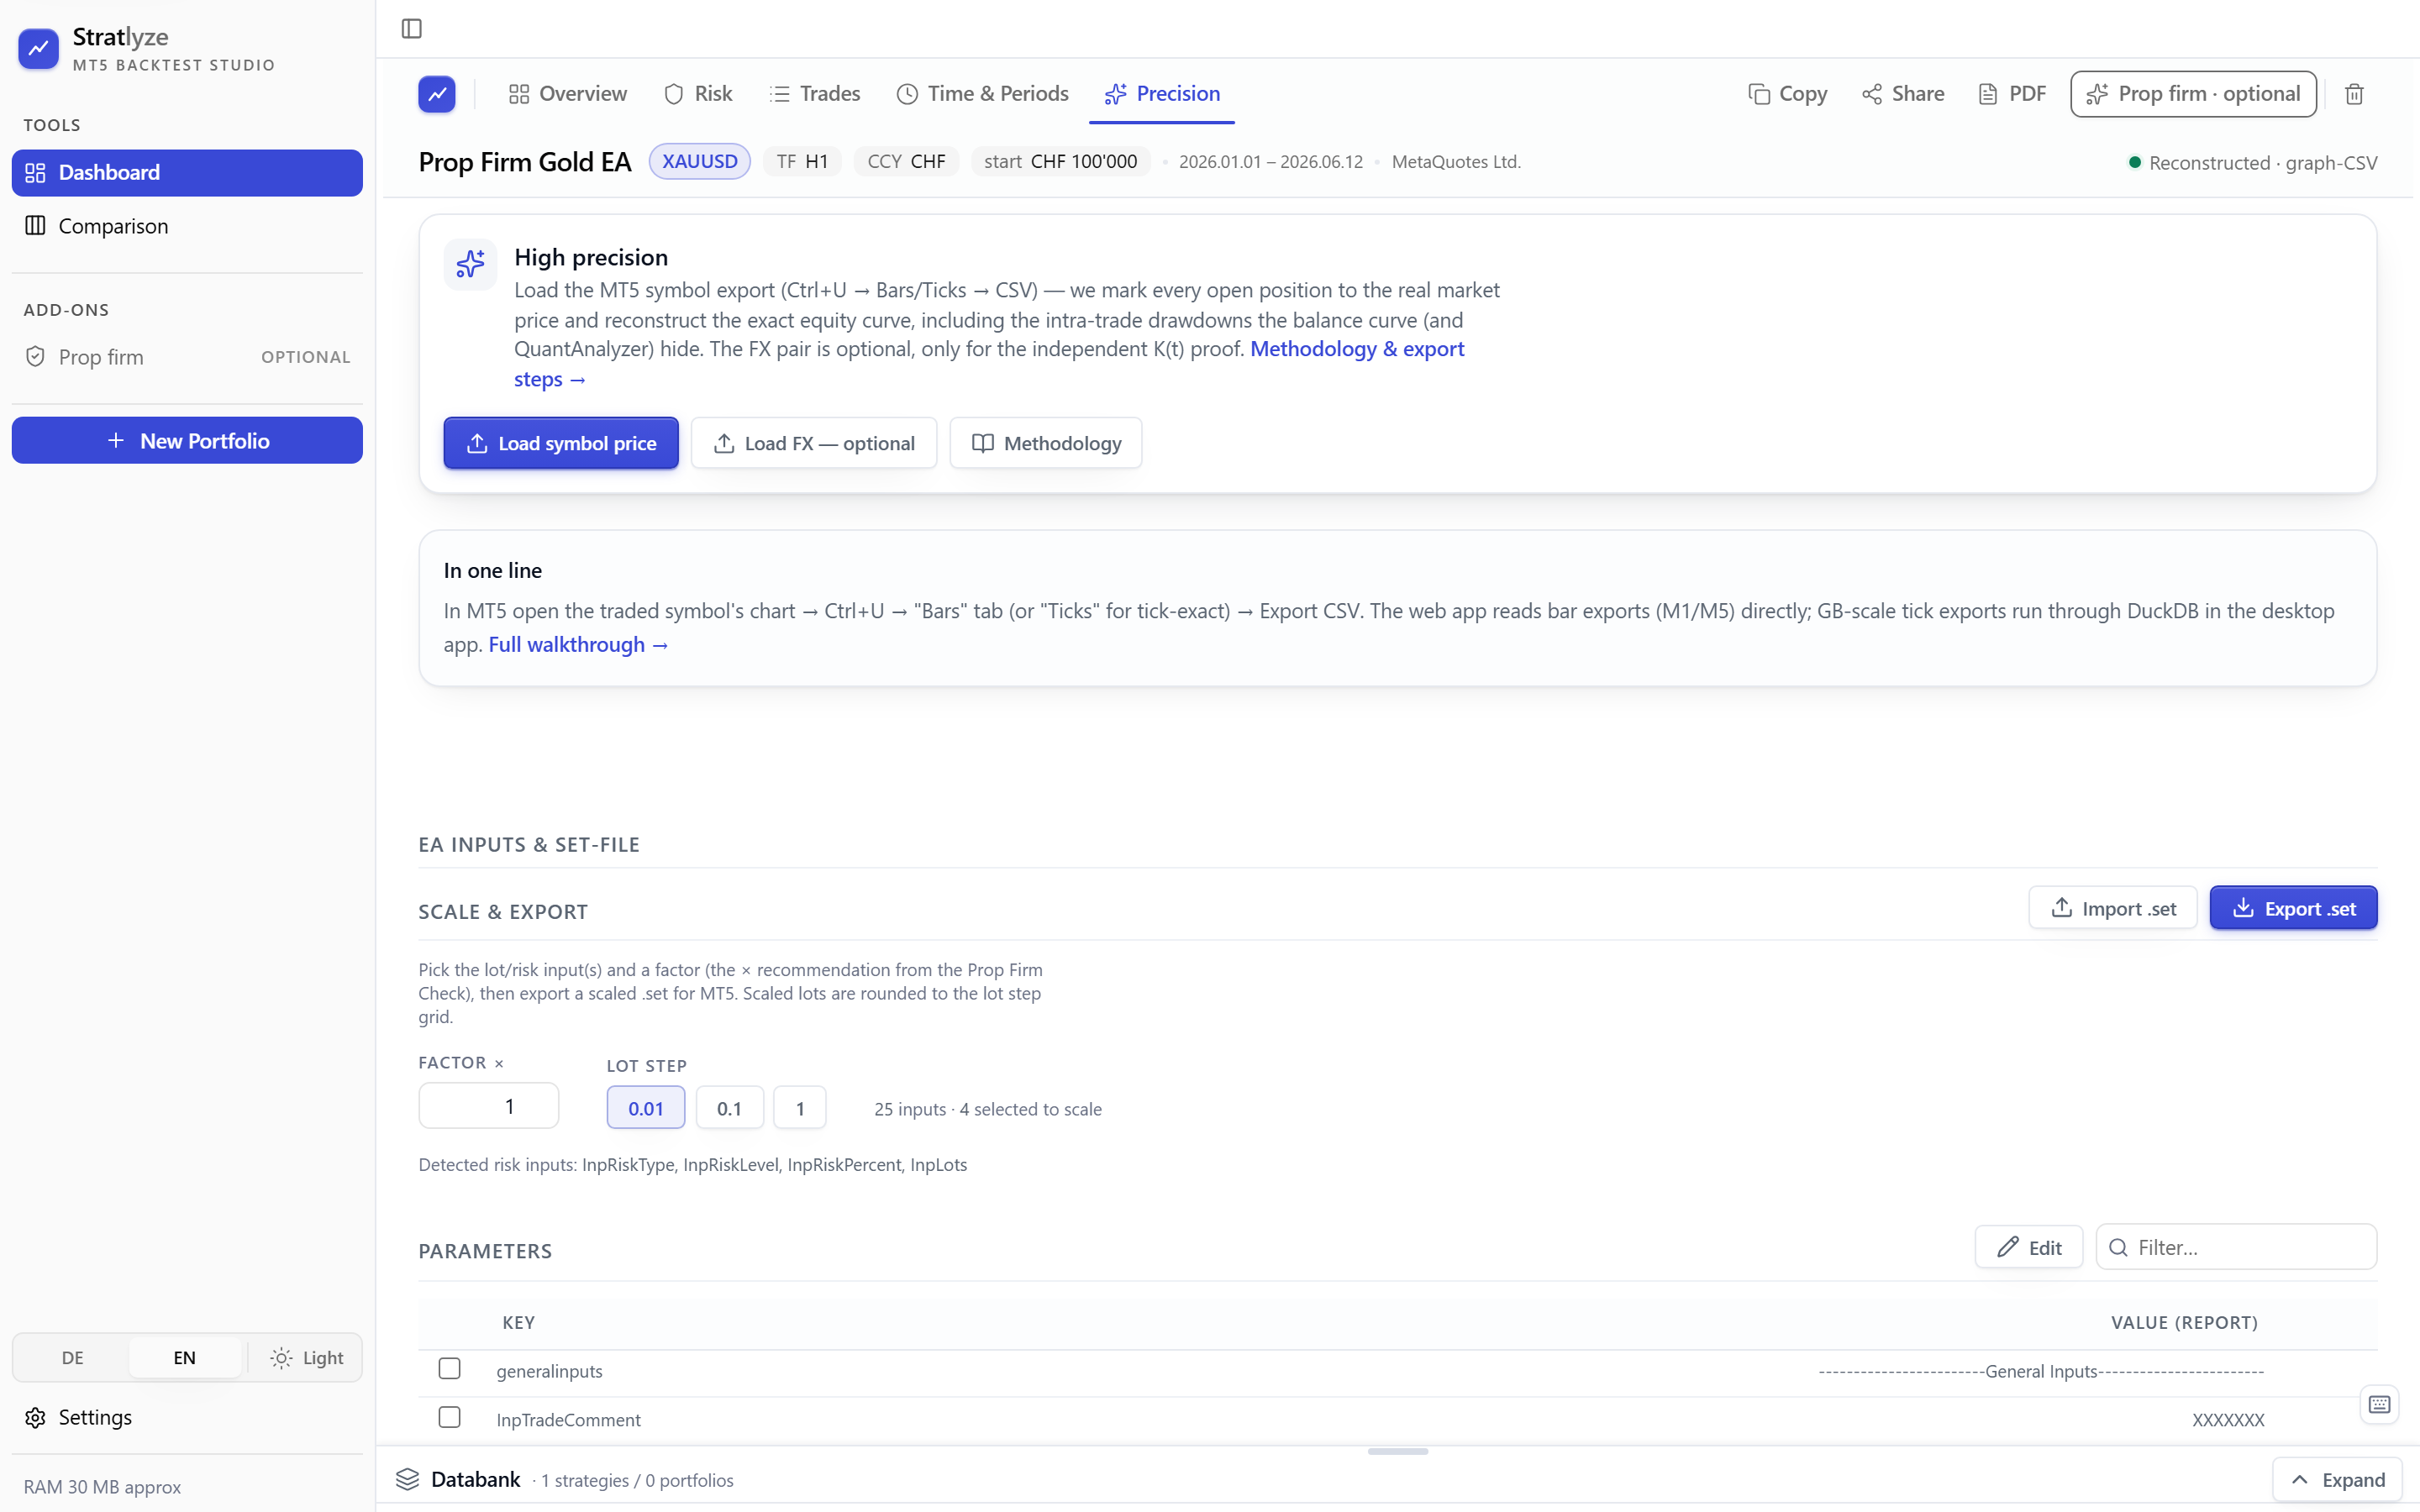
Reconstruct the exact equity curve, true intra-trade drawdown and exact Sharpe from MT5’s own price + FX export (Bars / Ticks). No interpolation — the curve to the resolution your data actually carries.

Sharpe 3.94 vs stated 3.92 · FX within 0.05%

Stratlyze high-precision mode reconstructing the exact equity curve and Sharpe from MT5 symbol-export Bars/Ticks data.

First-class dark mode

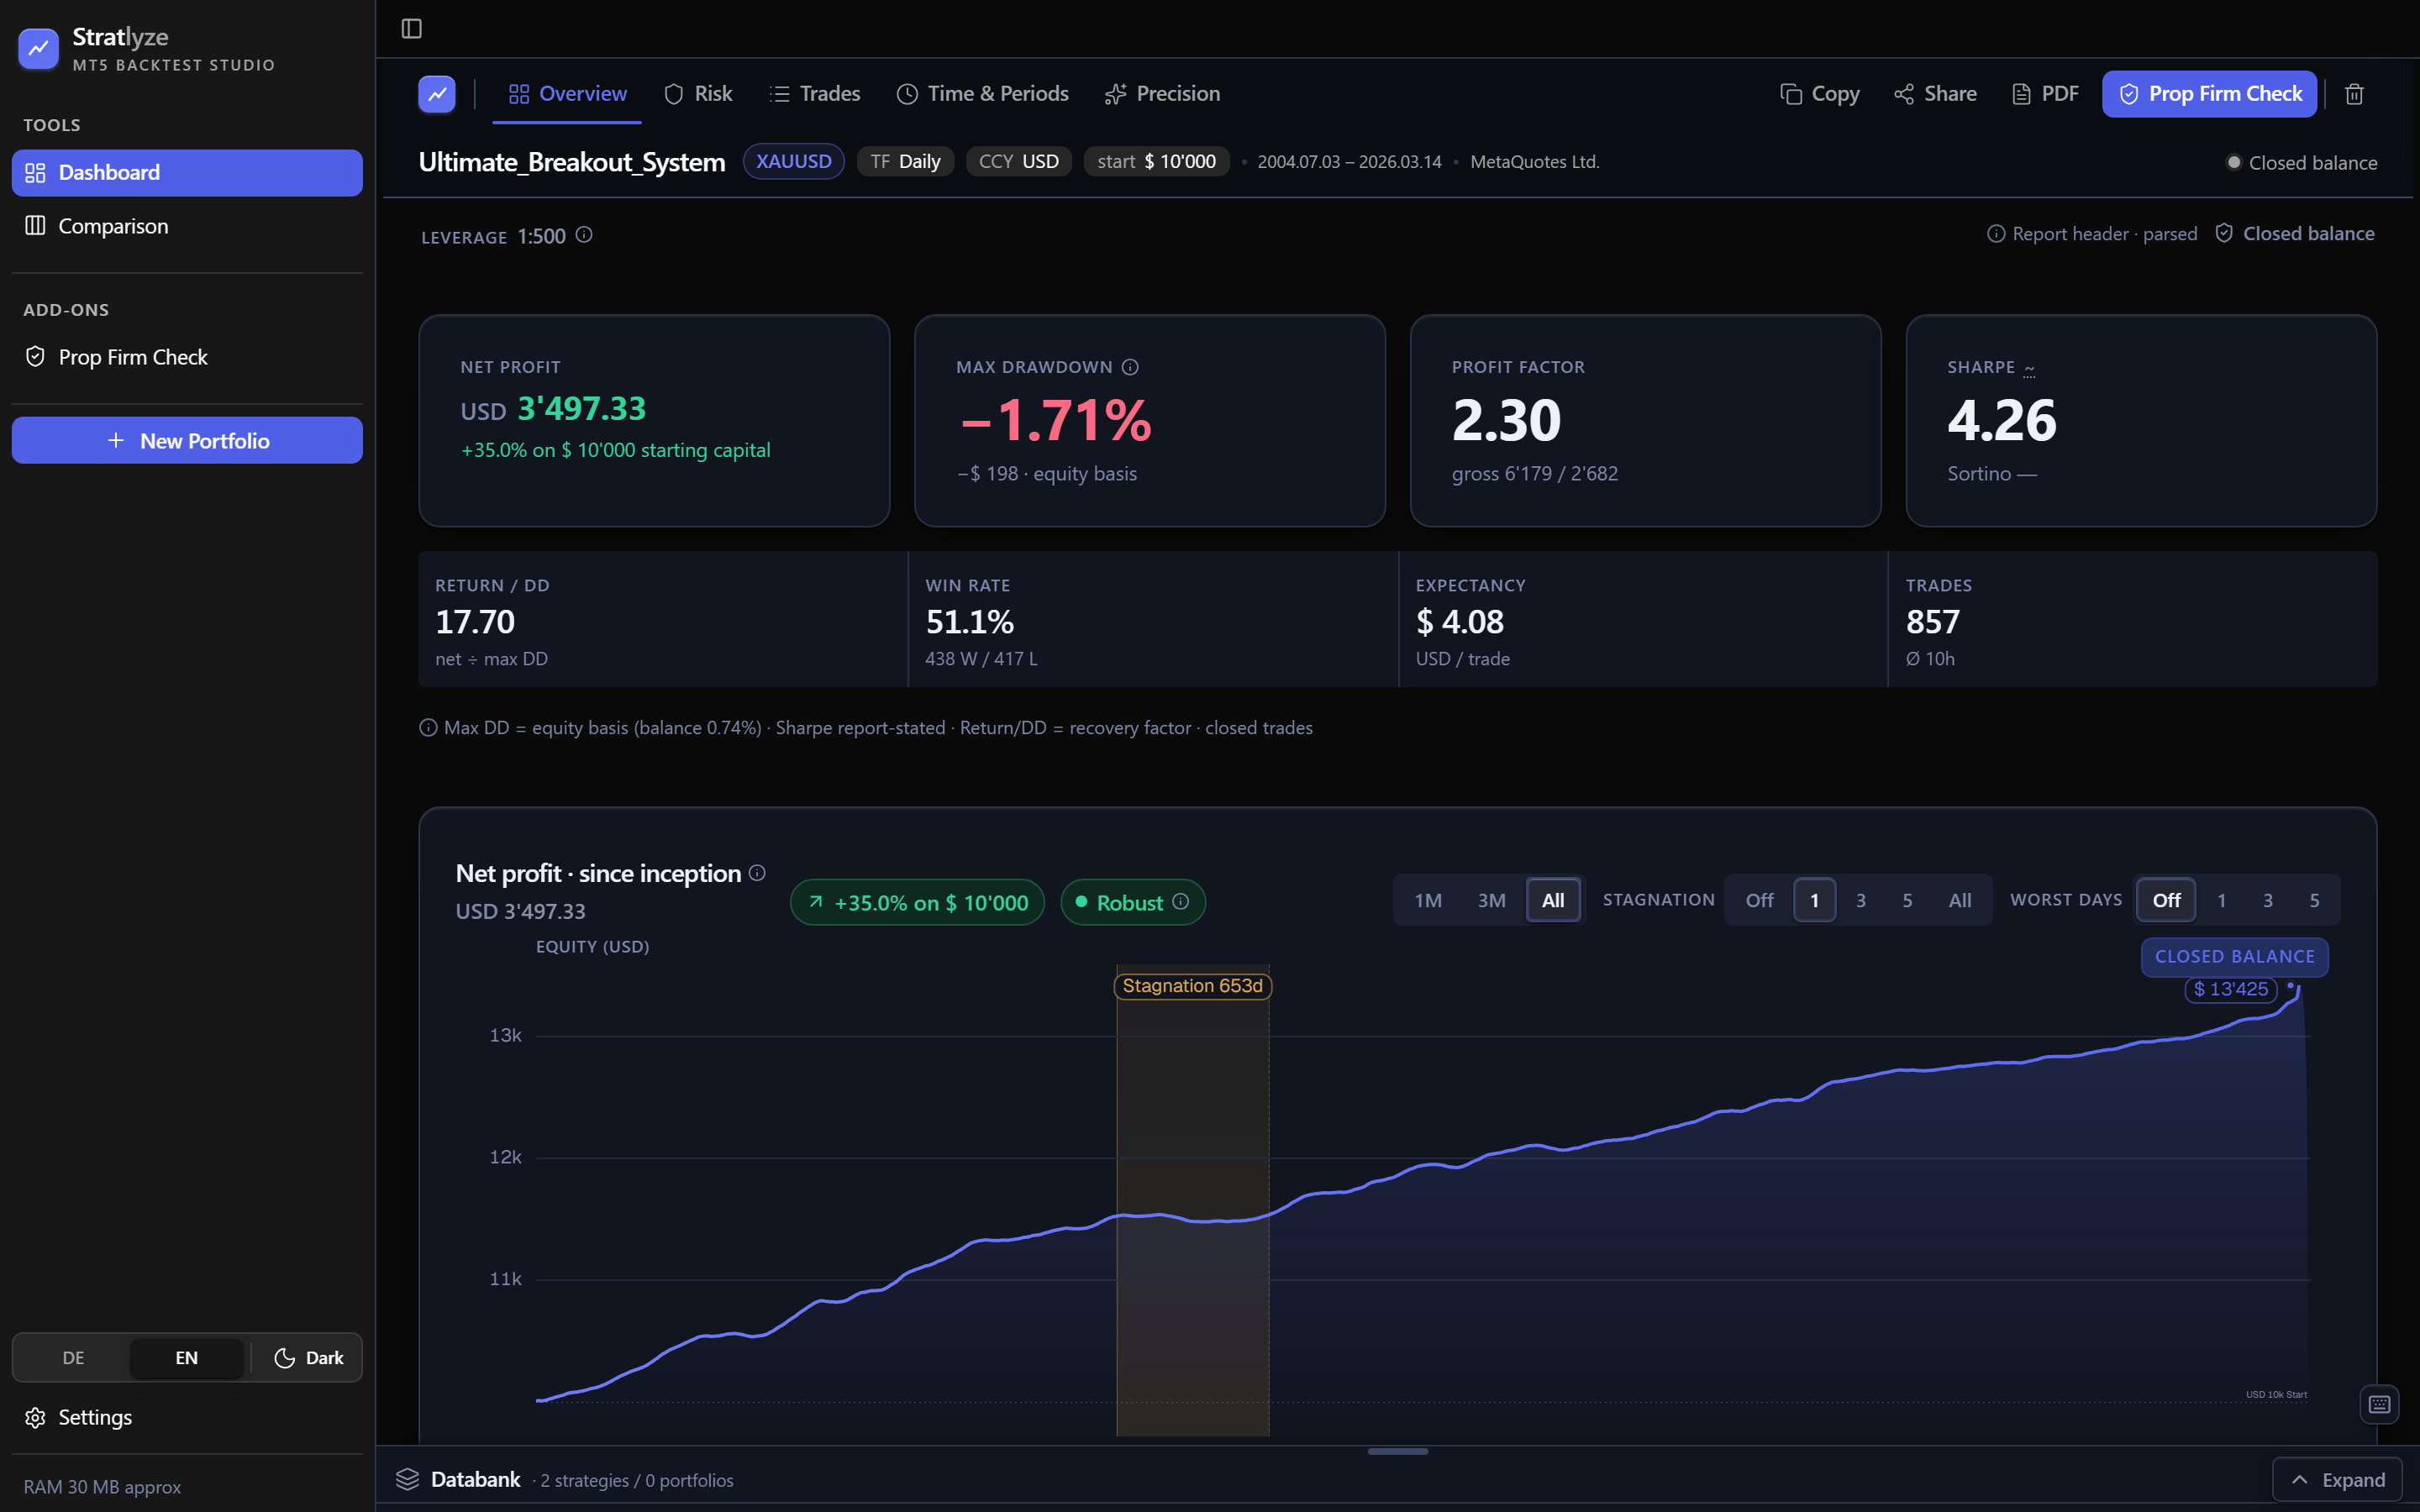
The same calm, monochrome studio in soft charcoal — not an afterthought. Every view is designed for both light and dark from the start.

Stratlyze dashboard in dark mode — the real equity curve and metric panels rendered in the soft-charcoal monochrome theme.

Drawdown & recovery

The underwater curve, recovery analysis and a monthly P&L heatmap show how deep and how long each drawdown ran — the view a balance line flattens out.

Set-file round-trip

Read an MT5 .set file, apply the lot factors you modelled, and write it back — your what-if sizing goes straight into the EA.

Best-subset finder

A greedy, correlation-penalized forward selection ranks combinations by the prop-rule headroom each leaves on your own backtest — a heuristic shortlist, never a Sharpe / return-max search.

In-sample · selection bias applies

Share as an image

Export a clean 1200×630 PNG of any strategy or portfolio card. Rendered locally on your machine — no upload, nothing leaves your browser.

Any currency, any labels

Reads UTF-16 MT5 exports in any account currency and maps German report labels automatically. Never hardcodes a dollar sign.

Desktop & web

The same engine runs as a Windows & macOS desktop app and as a 100% client-side web app. Identical results — both fully offline, nothing ever uploaded.

Deliberately out of scope: What-If parameter scenarios, money-management models, walk-forward, and exhaustive Sharpe-max subset optimization. (The best-subset finder is a lightweight heuristic, not that.) Our Monte Carlo reshuffles your real trades for a drawdown-distribution band — it never invents trades that didn’t happen. Stratlyze is an honest analyzer, not a curve-fitting toy.

Find out what your backtests really did.

Load one MT5 report and see the true equity curve, a rule-threshold report against the limits you configure, and exactly where those thresholds bite. Free during the beta. No account, no upload.

Desktop for Windows & macOSWeb app in any modern browserSame engine everywhere

No trading data ever leaves your machine. No login required to analyze.

macOS build is unsigned — one-time right-click › Open on first launch.

Analysis software only. Not financial advice. Connects to no account, executes no trades. No data leaves your device.